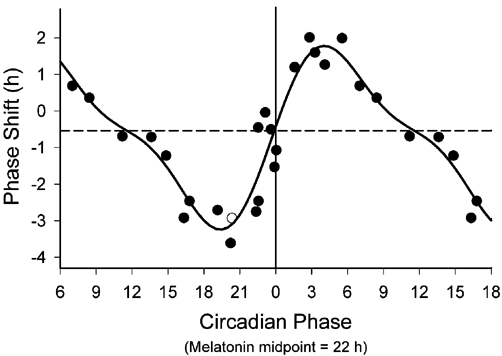
Figure 2.

The PRC to the bright light stimulus using melatonin midpoints as the circadian phase marker. Phase advances (positive values) and delays (negative values) are plotted against the timing of the centre of the light exposure relative to the melatonin midpoint on the pre-stimulus constant routine (defined to be 22 h), with the core body temperature minimum assumed to occur 2 h later at 0 h. Data points from circadian phases 6-18 are double plotted. The filled circles represent data from plasma melatonin, and the open circle represents data from salivary melatonin in subject 18K8 from whom blood samples were not acquired. The solid curve is a dual harmonic function fitted through all of the data points. The horizontal dashed line represents the anticipated 0.54 h average delay drift of the pacemaker between the pre- and post-stimulus phase assessments. Reproduced from: Khalsa SBS, Jewett ME, Cajochen C, Czeisler CA. A phase response curve to single bright light pulses in human subjects. J Physiol 2003; 549: 945–952 (with kind permission of Wiley-Blackwell, Oxford, UK).
