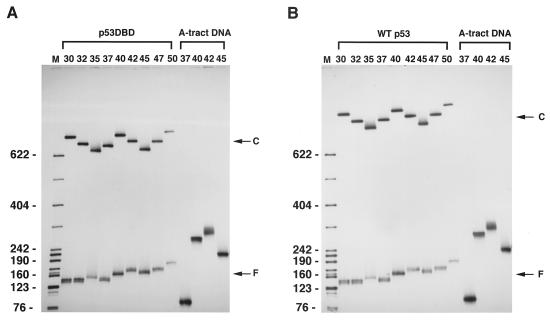
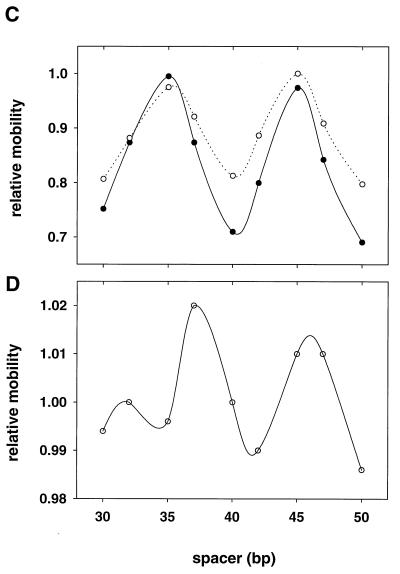
Figure 2.
Phasing gel analysis of DNA bending. p53DBD (A) and wt p53 (B) are bound to the three-segment constructs with spacers S3 (Fig. 1 A and B) with the lengths (in bp) indicated. Lane M shows mobilities of the markers. Labels C stand for the p53 complexes and F stands for free DNA. A-tract DNAs serve as “standard probes” to determine the adjusting parameter k (see Methods). (C and D) Relative mobility plots for the p53DBD-bound DNA (○ in C), for the wt p53–DNA complex (● in C), and free DNA (D). To calculate the relative gel mobilities, the free DNA mobility as a function of the spacer length was approximated by using a linear function. The observed mobilities (both for free DNA and for the complexes) were divided by these “ideal” values corresponding to a length-dependent retardation of DNA without intrinsic bends. The values so obtained were normalized separately by the maximum mobilities in each case so that the maximum relative mobility is always 1.0.


