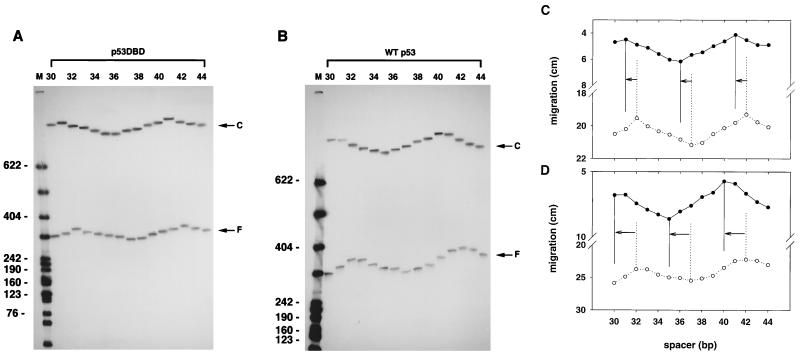
Figure 3.
Phasing gel analysis of DNA twisting. Gel mobilities of the p53DBD–DNA complex (A and C) and wt p53–DNA complex (B and D) are compared with the free four-segment DNA constructs (Fig. 1A). M, C and F are as in Fig. 2. The average mobility plots in C and D are given for three independent experiments (the individual measuments vary by no more than 0.4 cm for the complexes and 0.6 cm for free DNA).

