
Figure 1.
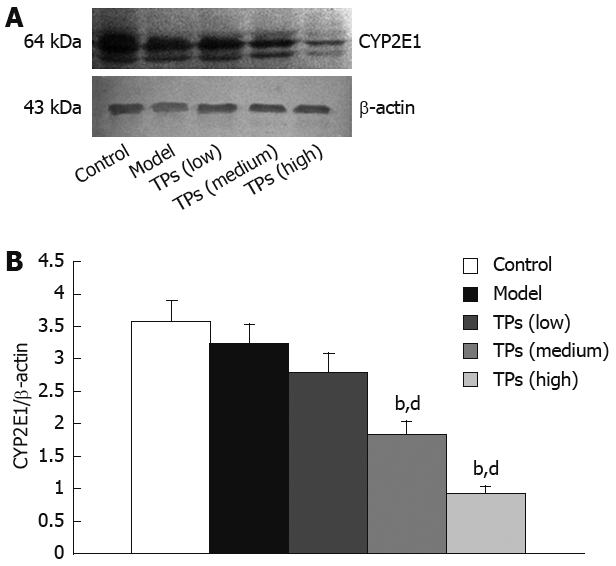
Western blot analysis of protein for CYP2E1 in liver tissue of mice showing representative bands of each group (A) and normalized densitometic ratios of CYP2E to β-actin (B). bP < 0.01 vs control group; dP < 0.01 vs model group.
Official websites use .gov
A
.gov website belongs to an official
government organization in the United States.
Secure .gov websites use HTTPS
A lock (
) or https:// means you've safely
connected to the .gov website. Share sensitive
information only on official, secure websites.
Western blot analysis of protein for CYP2E1 in liver tissue of mice showing representative bands of each group (A) and normalized densitometic ratios of CYP2E to β-actin (B). bP < 0.01 vs control group; dP < 0.01 vs model group.