
Figure 3.
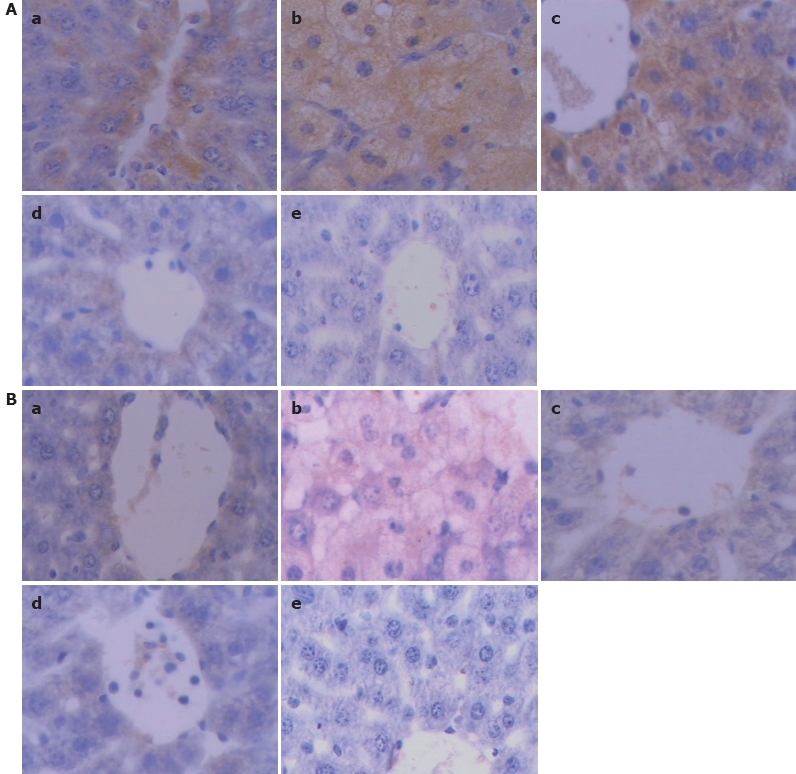
Immunohistochemical staining showing expression of CYP2E1 (A) and CYP1A2 (B) in liver tissue of mice 24 h after paracetamol administration (× 400) in control group (a), model group (b), low TP dose group (c), medium TP dose group (d) and high TP dose group (e). The brown or dark brown stained cells were considered positive.