
Figure 4.
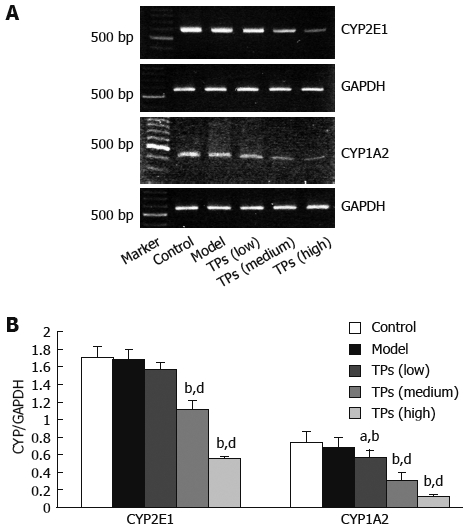
RT-PCR analysis of mRNA for CYP2E1 and CYP1A2 expression in liver tissue of mice showing representative bands of each group (A) and normalized densitometic ratio of CYP2E and CYP1A2 to GAPDH (B). aP < 0.05 vs model group; bP < 0.01 vs control group; dP < 0.01 vs model group.