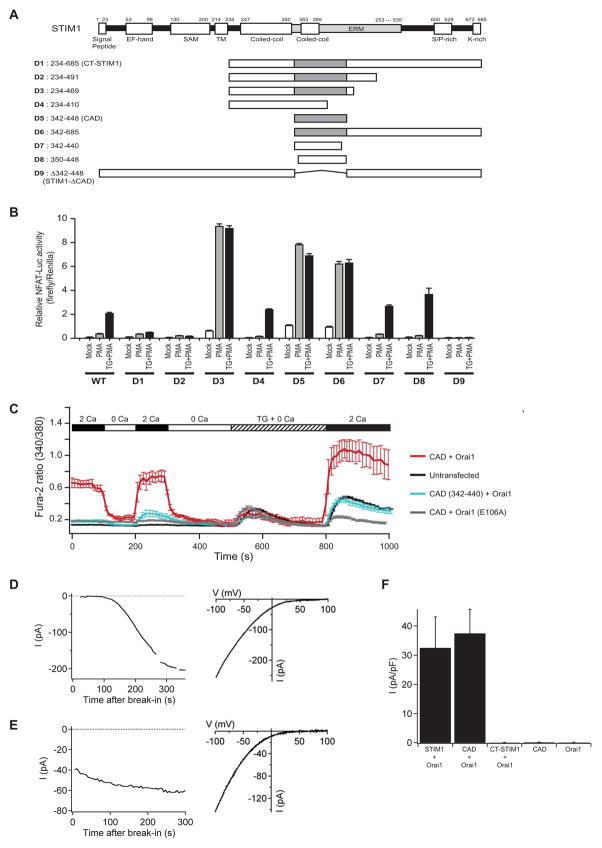
Figure 2. Identification of CAD as a Potent CRAC Channel Activator.
(A) Full-length STIM1 with its putative functional domains (top) and truncated versions of STIM1 (D1-D9; bottom) with the CAD shown in gray. (B) NFAT-dependent luciferase activity in HEK 293T (NFAT-Luc) cells transfected with wild-type (WT) or truncated (D1-D9) STIM1 constructs. Cells were treated with 1 μM PMA or 1 μM TG+PMA as shown. D5 (CAD) is the minimal region that is necessary and sufficient to activate NFAT. Data are shown as mean ± sem (n=4). (C) CAD activates SOCE without depleting intracellular Ca2+ stores. Mean [Ca2+]i (± sem) in untransfected HEK 293 cells (black; n=28) and cells expressing CAD + Orai1 (red; n=15), CAD + Orai1E106A (gray; n=17), or CAD (342–440) + Orai1 (blue; n=12). (D) (left) ICRAC develops slowly in a representative cell cotransfected with WT GFP-STIM1 + myc-Orai1. Current recorded during brief pulses to −100 mV in 2 mM Ca2+o is plotted against time after break-in. (right) Characteristic I–V relationship for ICRAC recorded in 20 mM Ca2+o from the same cell. (E) (left) ICRAC is constitutively active in a representative cell cotransfected with YFP-CAD + myc-Orai1. Current is plotted as in D. (right) I–V relationship for the CAD-induced current recorded in 20 mM Ca2+o from the same cell. (F) Current densities in cells transfected with CAD or Orai1 alone, or cotransfected with myc-Orai1 and GFP-STIM1, YFP-CAD, or YFP-CT-STIM1. Current measured at −100 mV during voltage ramps in 20 mM Ca2+o was normalized to the cell capacitance. Mean values ± sem from 4–5 cells are shown.

