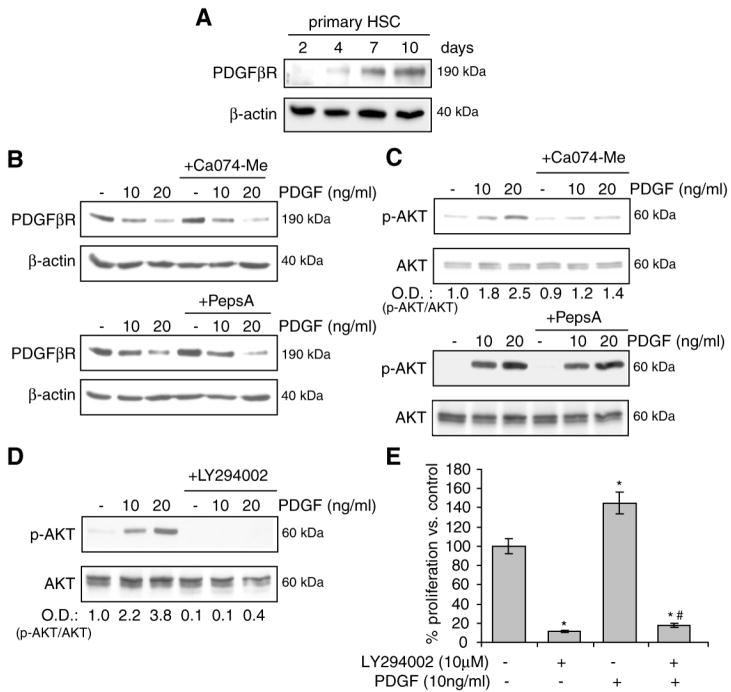
Figure 5.
PI3K/AKT activation after CtsB inhibition in vitro. (A) PDGFβR levels during mouse HSC activation from day-2 to day-10. (B) Effect of CtsB (Ca074Me 10μmol/L, 24h) or CtsD (Pepstatin A 10μg/ml, 24h) inhibition on PDGFβR degradation after challenge with PDGF (60 min), and on AKT phosphorylation after PDGF challenge (15 min) (C). (D,E) Effect of the PI3-kinase inhibitor LY294002 (10μmol/L, 60 min preincubation) on the phosphorylation of AKT by PDGF (15 min) (D), and on the proliferation for 24h (E). Data are mean±SD, in D, n=3 and *p≤ 0.05 vs. control HSC; # p≤ 0.01 vs. PDGF-treated HSC.

