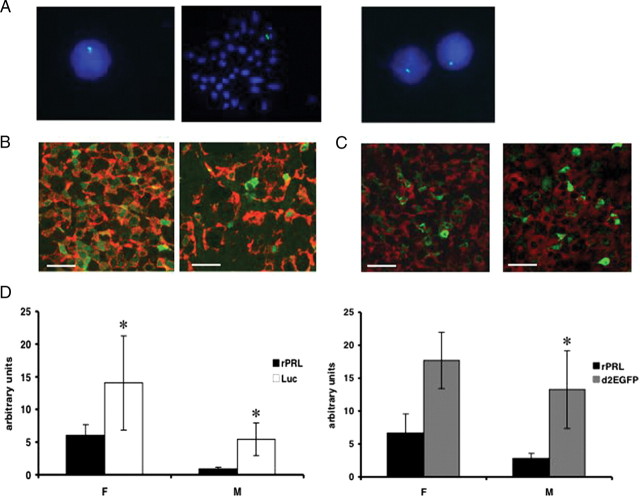
Fig. 3.
Molecular characterization of BAC PRL-Luc and PRL-d2eGFP transgenic rats. A, FISH analysis of metaphase and interphase nuclei of transgenic rat spleenocytes. Left panels, PRL-Luciferase line 49; right panel, PRL-d2eGFP line 455. B and C, Fluorescent immunocytochemistry of female (left) and male (right) pituitary sections. Green fluorescence: luciferase (panel B) or d2eGFP (panel C); red fluorescence indicates PRL. Scale bar, 20 μm. D, Real-time qPCR of luciferase, d2eGFP, and rat Prl in the pituitary gland of female and male transgenic rats. (*, P < 0.05 rat Prl vs. luciferase in males and females; n = 5 female; n = 4 male; *, P < 0.05 rat Prl vs. d2eGFP in males; n = 3 female; n = 4 male). F, Female; M, male.

