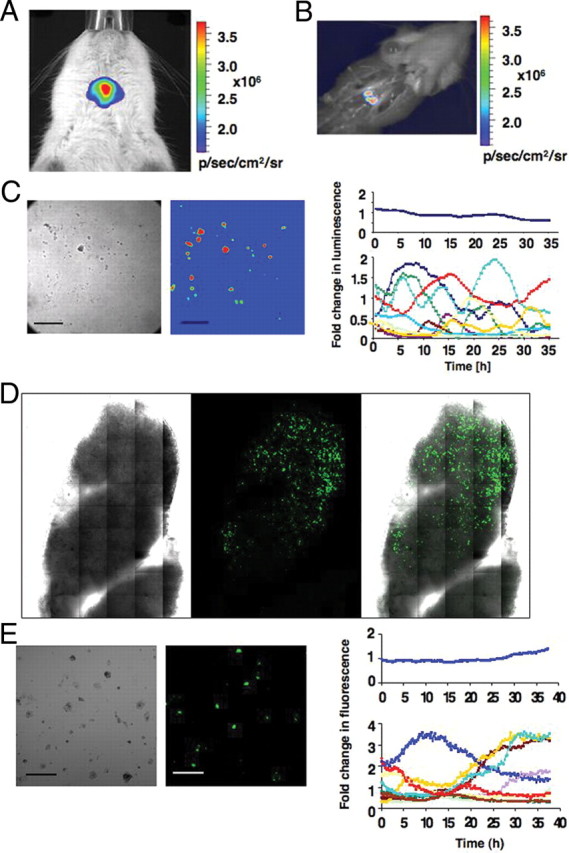
Fig. 4.

In vivo imaging and ex vivo analysis of BAC PRL-Luc and PRL-d2eGFP transgenic rats. A, In vivo imaging of a female BAC PRL-Luc transgenic rat. The image was acquired with an IVIS Spectrum (Caliper Life Sciences): 60 sec integration time, Bin 4, FOV 6.6, f1. B, Image taken after the rat has been euthanized. C, Ex vivo imaging of single-cell preparations derived from PRL-Luc transgenic rat pituitary. Left, Bright-field image of the pituitary cells. Middle, Pseudocolor image of the same cells. Right, Quantification of the dynamic changes in luminescence from individual cells. Scale bar, 200 μm. D, Tile scan imaging, with a ×40 1.3 fluar objective, of a pituitary thick section (400 μm) from PRL-d2eGFP rat. E, Ex vivo imaging of single-cell preparations derived from PRL-d2eGFP rat pituitary. Left, Bright-field image of the pituitary cells. Middle, Color image of the same cells. Right, Quantification of the dynamic changes in fluorescence from individual cells. Scale bar, 200 μm.
