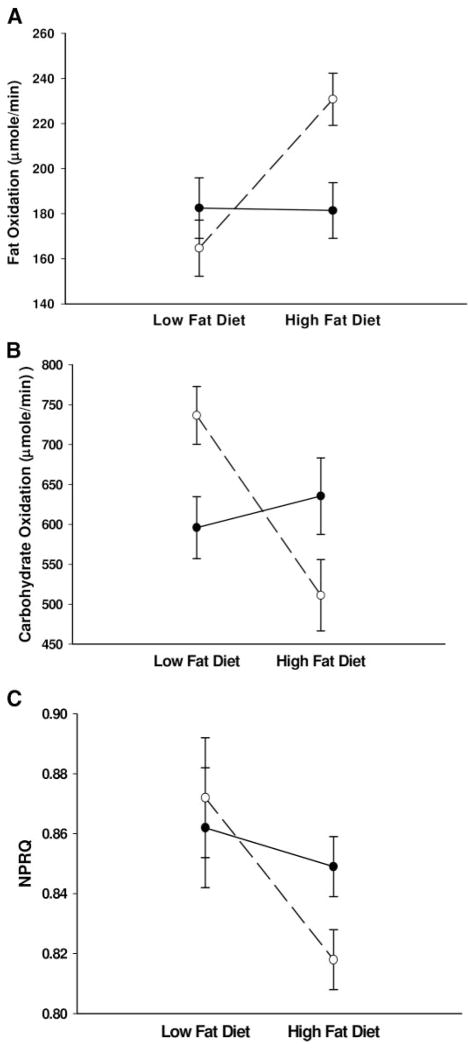
Fig. 1.
A, FO rates; B, CO rates; C, NPRQ in Caucasian (○) and African-American (●) women during HF and LF diets. A, The diet by race interaction was P < 0.01 and the change within Caucasian women was P < 0.01 and within African-American women was P = 0.86 (LF vs. HF); B, the diet by race interaction was P < 0.01 and the change within Caucasian women was P < 0.01 and within African-American women was P = 0.69; C, the diet by race interaction was P = 0.10 and the change within Caucasian women was P < 0.01 and within African-American women was P = 0.42.

