
Fig. 6. Effect of cholesterol depletion on PRR expression.
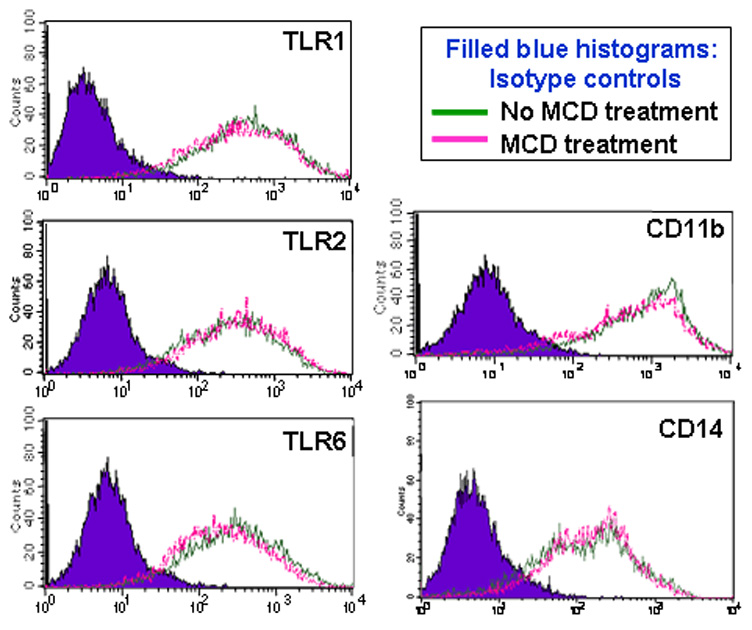
J774A.1 macrophages were treated or not with MCD (10 mM) for 30 min. Flow cytometry was then used to analyze expression of surface PRRs (TLR1, TLR2, TLR6, CD11b, and CD14) using appropriate FITC-labeled mAbs. The histograms shown are from one of three independent experiments that yielded similar findings.