
FIGURE 1.
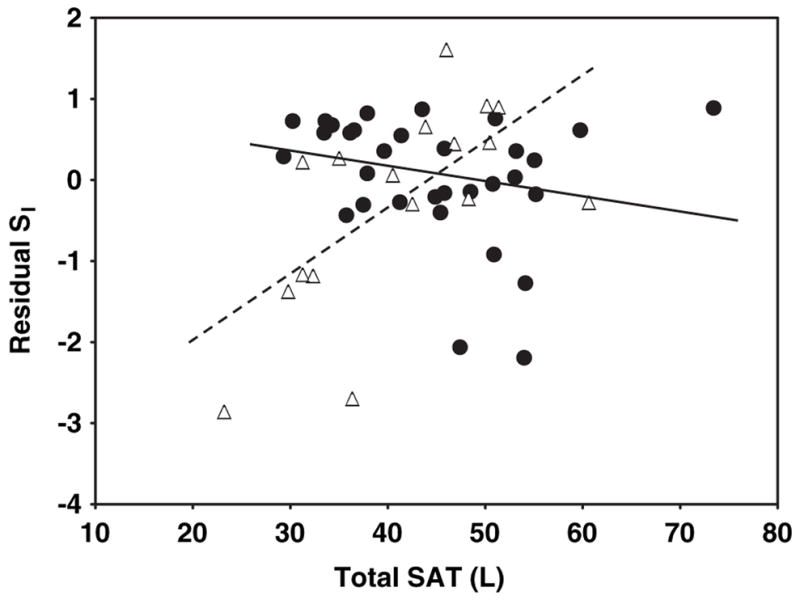
Relation between residual insulin sensitivity (SI) and total subcutaneous adipose tissue (SAT) in HIV-positive (HIV+; △) and control (●) women. SI values were log transformed for normality. Residual SI is the difference between the observed and the expected values of SI, calculated through multiple regression as a function of age, height, and weight. SAT was measured by whole-body magnetic resonance imaging. P < 0.001 for interaction of slopes by HIV status. r = 0.64 (P = 0.006) for HIV+ women and r = −0.22 (P = 0.2) for control women.