
FIGURE 4.
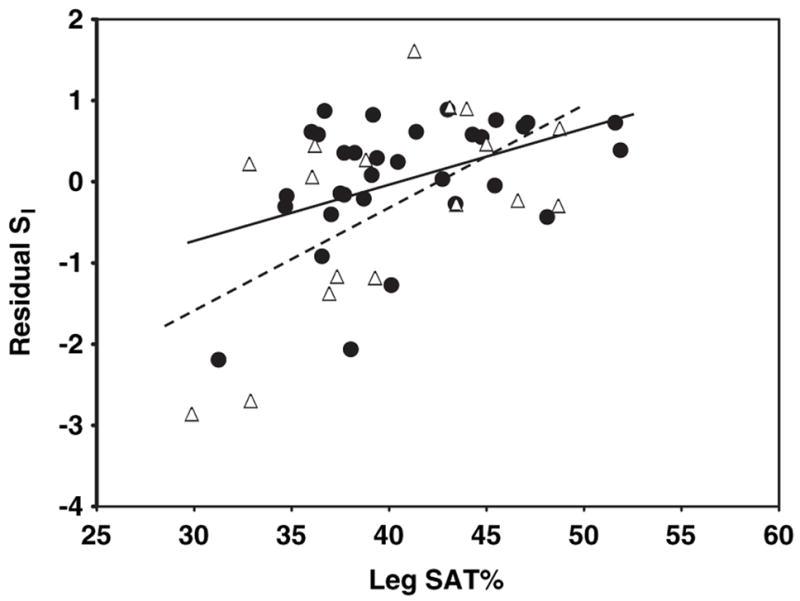
Relation between residual insulin sensitivity (SI) and sub-cutaneous adipose tissue (SAT) as a percentage of total SAT (leg SAT%) in HIV-positive (HIV+; △) and control (●) women. SI values were log transformed for normality. Residual SI is the difference between the observed and the expected values of SI, calculated through multiple regression as a function of age, height, and weight. Leg SAT (inferior to the greater trochanter) was measured by whole-body magnetic resonance imaging. P = .22 for interaction of slopes by HIV status.