
Figure 3.
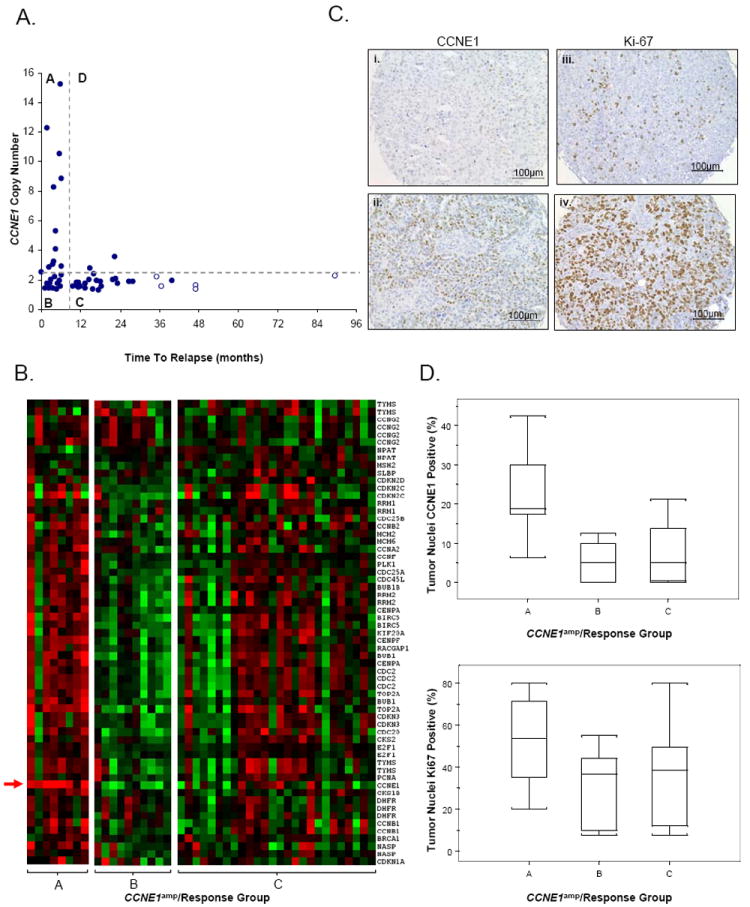
Characterization of tumor subtypes classified by treatment response and CCNE1 amplification status. (A) Samples stratified by treatment response (Resistant, <6 months PFS; Responsive, >9 months PFS) and CCNE1 amplification (CCNE1amp) status as estimated by quantitative-PCR. Amplification is defined as a log2 copy number ratio > 0.3. Four subtypes are observed; Group A (CCNE1 amplified, Resistant), Group B (CCNE1 unamplified, Resistant), Group C (CCNE1 unamplified, Responsive) and Group D (CCNE1 amplified, Responsive). Censored survival data represented by clear circles. (B) Gene expression heat-map of cell cycle genes in CCNE1amp/Response Groups A, B and C. Red indicates increased gene expression, green indicates decreased gene expression. CCNE1 gene expression probe indicated by arrow. (C) Example of tumor tissue with (i) 20% and (ii) 60% of cells with CCNE1 staining and (iii) 10% and (iv) 90% of tumor cells with nuclear Ki-67 staining. (D) Box plots depict range of IHC staining for CCNE1amp/Response Groups A, B and C for (top) CCNE1, p<0.02 and (below) Ki-67, p<0.28. Values for each sample taken as the average of up to four TMA cores. A total of 5, 7 and 16 tumors from each group A, B and C respectively (n = 28) are represented.