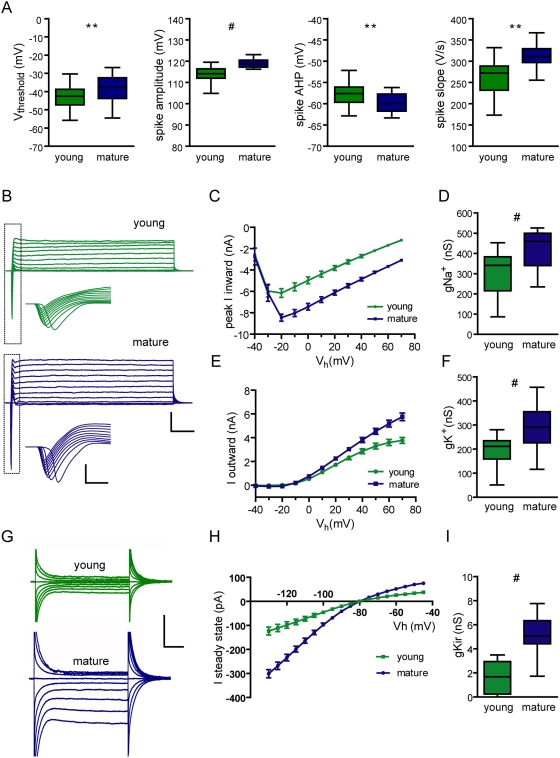
Figure 5. Active membrane properties of young neurons.
(A) Characterization of action potentials recorded in young and mature neurons. Spiking threshold, N = 38 (young) and 55 (mature); (*) denotes p = 0.011. Spike amplitude, N = 23 (both), (#) denotes p<0.0001. Spike slope measured from the 10–90% rising phase, N = 23 (both), (#) denotes p = 0.0002. AHP measured as the absolute peak value, N = 23 (both), (**) denotes p = 0.0024. Box plots depict the median (line), 25–75% percentile (box limits) and the maximum and minimum values (whiskers). Statistical analysis was done using a two-tailed t-test. (B) Typical examples of inward (downward deflections) and outward (upward deflections) currents recorded in response to depolarizing voltage steps (−40 to 70 mV, step 10 mV, 200 ms) in a 25 dpi (green) and a mature DGC (blue). Scale bars: 5 nA, 50 ms. Insets depict expanded views of the squared areas (scales: 5 nA, 1 ms). (C) I–V curve for voltage-gated Na+ currents, displaying different amplitudes for young and mature cells (ANOVA, p<0.0001, N = 26 young and 29 mature DGCs). (D) Na+ conductance measured at Vh = −20 mV; (#) denote p<0.0001. (E) I–V curve for voltage-gated K+ currents measured at steady state showing significant differences (ANOVA, p<0.0001). (F) K+ conductance measured at Vh = 70 mV; (#) correspond to p<0.0001. (G) Inward rectifying currents evoked by current steps from −40 to −130 mV (step 5 mV, 100 ms) recorded from a 23 dpi and a mature DGC. Scale bars: 200 pA, 20 ms. (H) Average I–V plots displaying inward rectifier K+ currents are significantly larger in mature neurons (p<0.0001), ANOVA with N = 19 (young) and 17 (mature). (I) K+ inward-rectifier conductance; (#) denotes p<0.0001.

