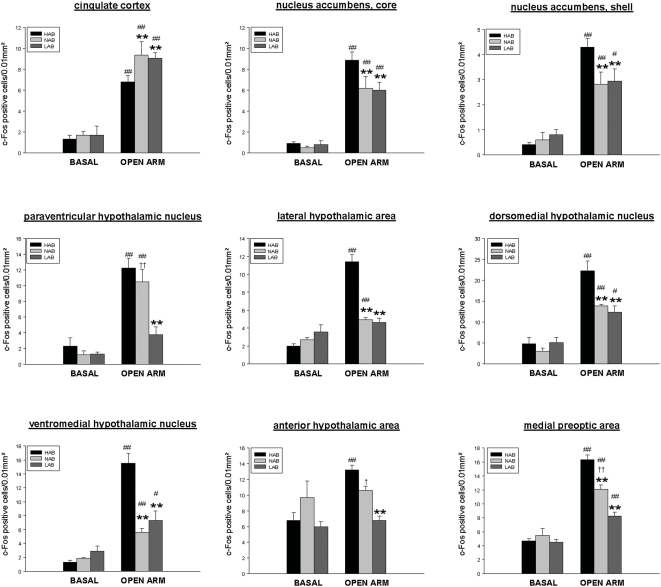
Figure 4. Quantitative analysis of c-Fos immunoreactivity in HAB, NAB and LAB mice under basal conditions and after OA exposure.
Depicted are those areas (cortical, accumbal and hypothalamic areas), for which the Fischer LSD post hoc test revealed statistically significant differences in OA-stress-induced c-Fos response in HAB, NAB and LAB mice. Each column indicates the mean±SEM number of c-Fos positive cells in a tissue area of 0.01mm2 (total c-Fos expression was quantified in the dentate gyrus). Basal groups: n = 5, OA-exposure: HAB: n = 9, NAB: n = 8, LAB: n = 8; *p<0.05, **p<0.01 vs HAB OA-group; # p<0.05, ## p<0.01 vs corresponding basal group; + p<0.05, ++ p<0.01 vs LAB OA-group;

