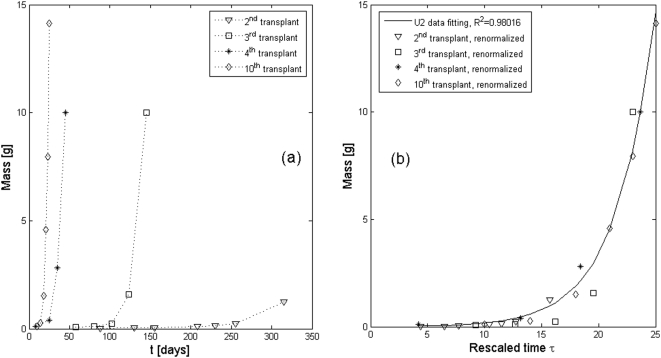
Figure 4. MPE results from G. G. Steel.
Up to 10 transplants of cells from the tumoral line rat fibroadenoma have been performed, but the curves corresponding to only four of them have been reported [9]: see (A). As discussed in Methods, the averaged growth curves become increasingly steeper with successive passages, due to the aging of the newly transplanted tumor cells. By rescaling the time (see Equation 3) with a suitable choice of the parameter ρ, we obtain a plot (B), in which all the curves are collapsed into a single one, belonging to the PUN class U2. The fitting parameters are reported in Table 2.

