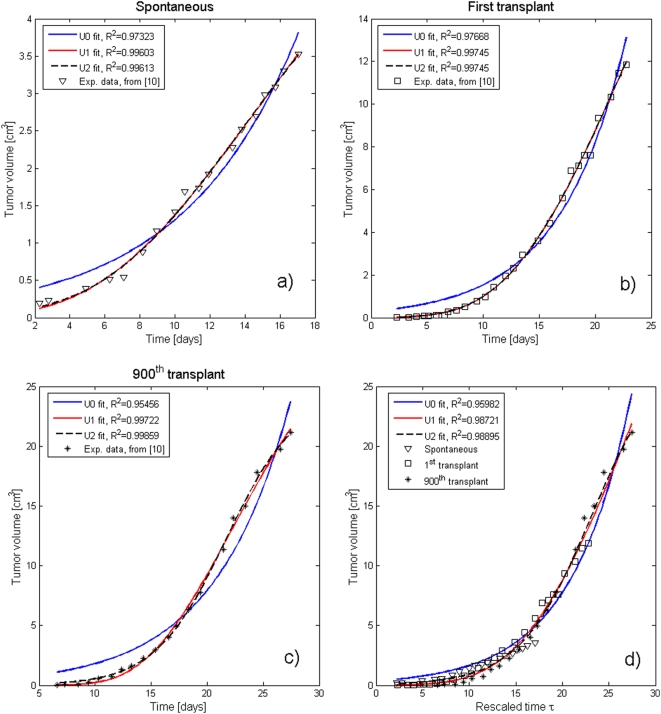
Figure 6. MPE results from McCredie et al. [10].
As many as 900 transplants of cells from the tumoral line C3H rat mammary carcinoma have been performed, but the curves corresponding to only the original one, the first and the last (900th) transplant have been reported: (A–C), respectively. For all of them the fits of the data corresponding to the classes U0, U1, and U2 have been included. There is an obvious improvement when one goes from U0 to U1 and a much smaller one from U1 to U2. The latter, in fact, yelds an almost perfect agreement with the experimental data. As in the case of Steel's data, in (D) the growth curves are normalized and displayed as a single group of data vs. the rescaled time τ. Here, as in Figure 4B, a U2 curve gives an excellent fit to the regrouped data. It is indeed remarkable that after as many as 900 transplants the tumor still grows with the same law (a part from the time “rescaling”). The fitting parameters are reported in Table 3.

