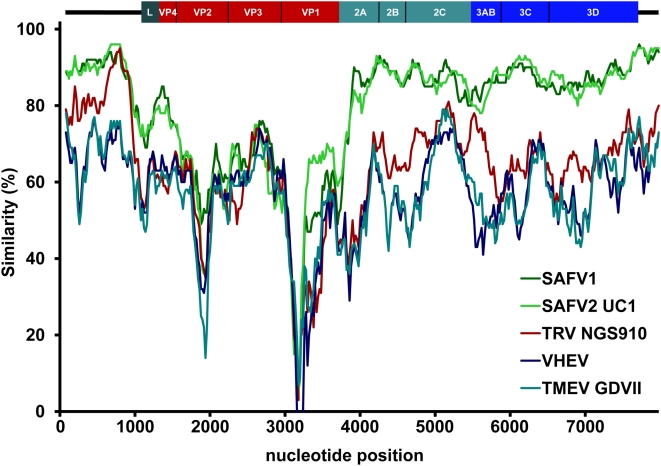
Figure 1. Similarity plot analysis based on complete cardiovirus sequences using SAFV-3 (NL2007) as query sequence.
Analysis made use of a sliding window of 200 bases and a step size of 20 bases. The y-axis shows the percentage of similarity between the selected cardiovirus sequences and the query sequence.

