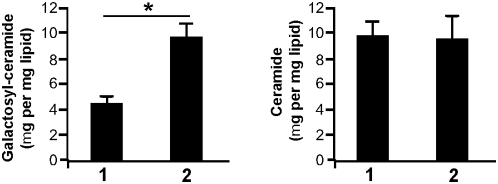
Figure 10. Ceramide levels in wt TG cells and CF-TG cells.
Total lipids were extracted from wt TG cells (1) and CF-TG cells (2), and separated by one-dimensional thin-layer chromatography. Galactosyl-ceramides and ceramides were quantified by scanning using standard calibration curves (r2). The results, which represent means±SEM of 5 determinations, are expressed in µg galactosyl-ceramide (A) or ceramide (B) per mg of total lipids. *P<0.05.

