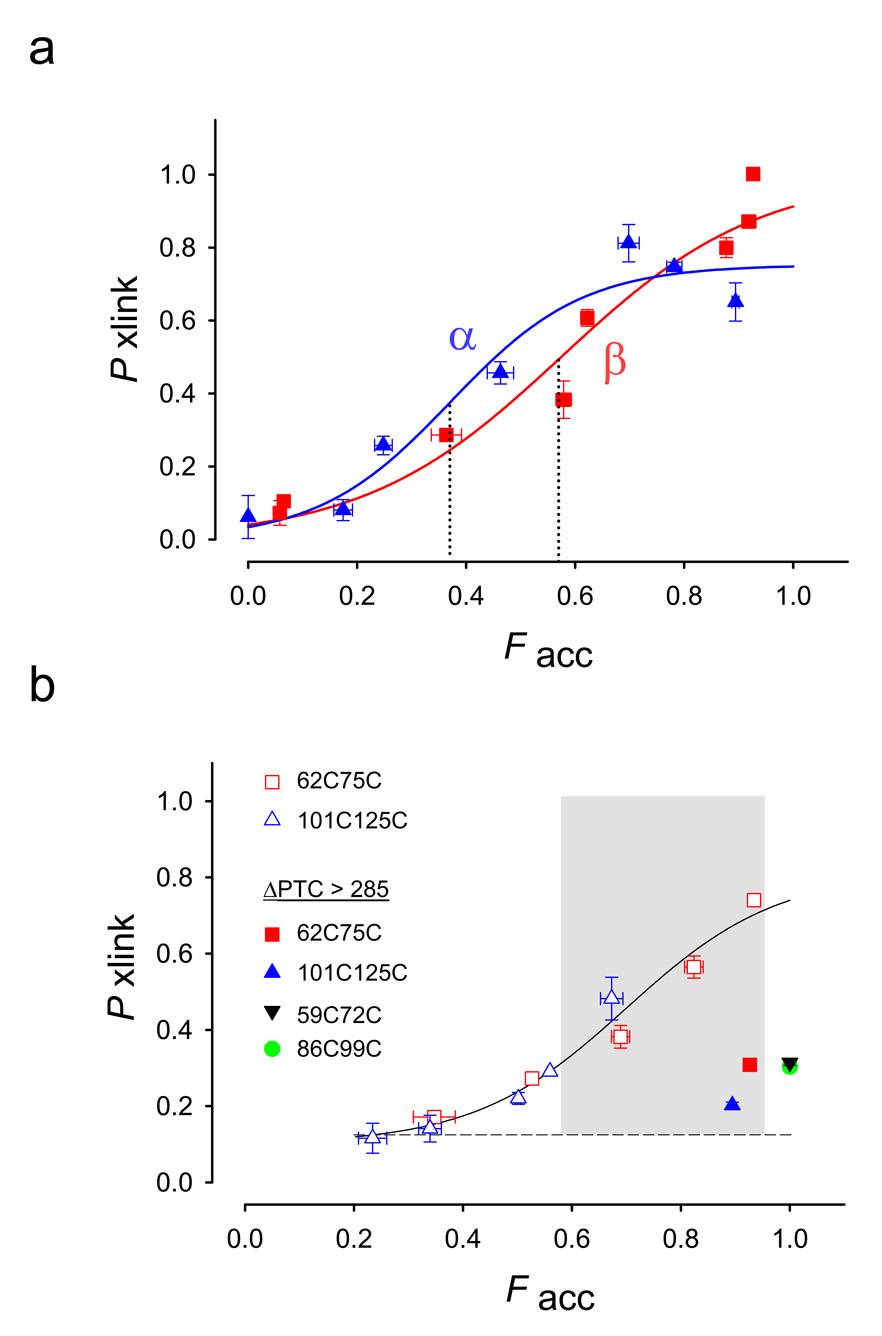
Figure 3. Accessibility-Dependent Probability of Crosslinking.
(a). Probability of crosslinking, Pxlink, as a function of the fraction of accessible peptide, Facc. Data are derived from crosslinking and accessibility assays (exemplified in Fig. 2) for β-hairpins (red squares) α-helical hairpins (blue triangles) and fit to a sigmoidal function with two parameters (SigmaPlot 8.0). Data are means ± SEM for at least triplicate measurements. The dotted lines indicate F50 values as defined in the text. The β-hairpin has F50 = 0.37 ± 0.06, whereas the α-helical hairpin has F50= 0.57 ± 0.10. These midpoints are not significantly different (P= 0.075, Z-test). The ΔPTC values are (increasing order of Facc) 21, 25, 27, 29, 39, 322, 52, and 86 (latter two occur at the same Facc) for the β-hairpin and 3, 19, 24, 29, 40, 52, and 239 for the α-hairpin. (b) Probability of crosslinking of 62C75C (red squares) and 101C125C (blue triangles). A curve was drawn through all the data points, but no particular function is intended. The shaded region indicates a region in which peptides can be crosslinked (an entropic window). All filled symbols represent cysteine pairs far outside the tunnel on a long tether (ΔPTC values > 285). Pxlink for these constructs is 0.2–0.3. Pxlink for both 86C99C (filled green circle) and 59C72C (filled inverted black triangle) is ~0.3, in agreement with 62C75C (filled red square) at this same location. The ΔPTC values are (increasing order of Facc) 30, 35, 37, 43, 67 and 313 for the 62C75C constructs and 27, 38, 41, 48, 43, and 263 for the 101C125C constructs. Data are means ± average error or ± SEM for 2–4 replicate samples, except for points at ΔPTC 48, 67 and the 86C99C construct (green filled circle) at ΔPTC 289. For all other points, errors are either clearly visible or within the symbol.

