Fig. 3.
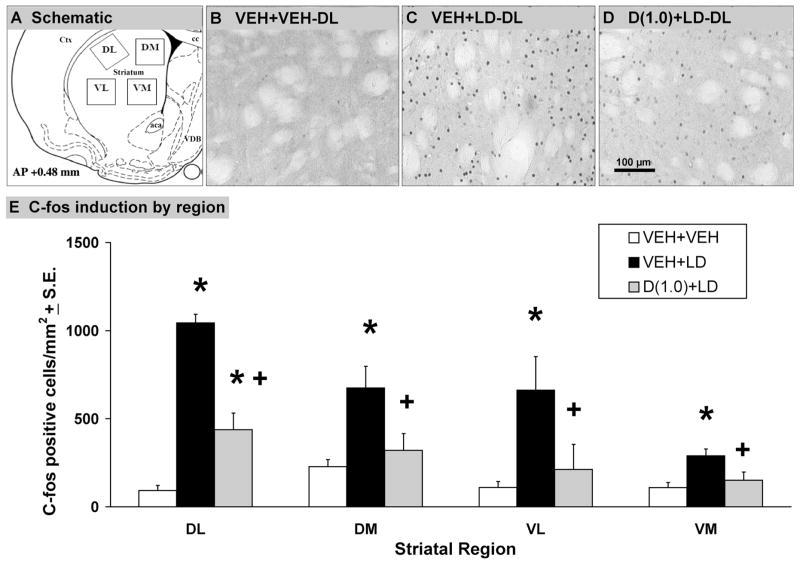
L-DOPA-induced striatal c-fos expression is reduced by ±8-OH-DPAT. In a between-subjects design, groups of L-DOPA-primed rats with equivalent AIMs expression (n = 4 rats/group) were randomly assigned to receive either vehicle followed 5 min later by another vehicle injection (VEH+VEH), vehicle 5 min after L-DOPA + benserazide (12 +15 mg/kg, i.p.; VEH+LD) or ±8-OH-DPAT (1.0 mg/kg, i.p.) followed by L-DOPA + benserazide (D(1.0) + LD). Rats were killed 1 hr after L-DOPA treatments and immediately perfused, after which 50-μm sections were processed for c-fos immunohistochemistry. A: Schematic depiction of dorsolateral (DL), dorsomedial (DM), ventrolateral (VL), and ventromedial (VM) striatal regions analyzed for c-fos expression by ImageJ software (NIH) and photorepresentations of (B) VEH+VEH, (C) VEH+LD, and (D) D(1.0) + LD treatments on striatal c-fos induction in the DA-lesioned DL striatum are shown. Scale bar = 100 μm. E: Scale bars depict the effects of treatments on striatal c-fos induction by region, expressed as mean number of c-fos positive cells/mm2 ± SEM. Main treatment effects were determined by one-way ANOVA. Significant differences within each striatal region were established by planned comparison post hoc comparisons. *P < 0.05 vs. VEH + VEH; +P < 0.05 vs. VEH + LD. Anatomic structures: Aca, anterior commissure; Cpu, caudate putamen; Cc, corpus callosum; Ctx, cortex; LV, lateral ventricle.

