
Fig. 3.
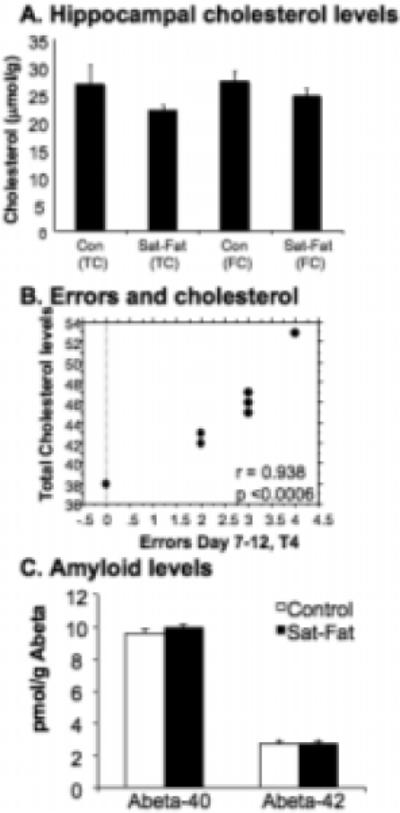
Brain Cholesterol, Behavior and Aβ levels. A) Brain cholesterol was measured in extracts of the hippocampus as described in materials and methods and presented as micromol/g (mM). Consistent with previous studies, brain cholesterol levels are not altered despite the large increase in plasma cholesterol. Note: Total and free cholesterol measurements indicate that the levels of esterified cholesterol in the hippocampus are very small and remain unaltered with the diet. B) There was a significant correlation between WMI errors (Day 7−12, trial 4) and plasma cholesterol levels in the control group (r = 0.938; p < 0.0006). Thus, more WMI errors were found in rats with the highest cholesterol levels. The lines in the graph represent 95% confidence bands (for slope). C) No difference was found between the Sat-Fat group and animals fed a control diet in terms of Aβ40 or Aβ42 levels, as measured in cerebral cortex samples.