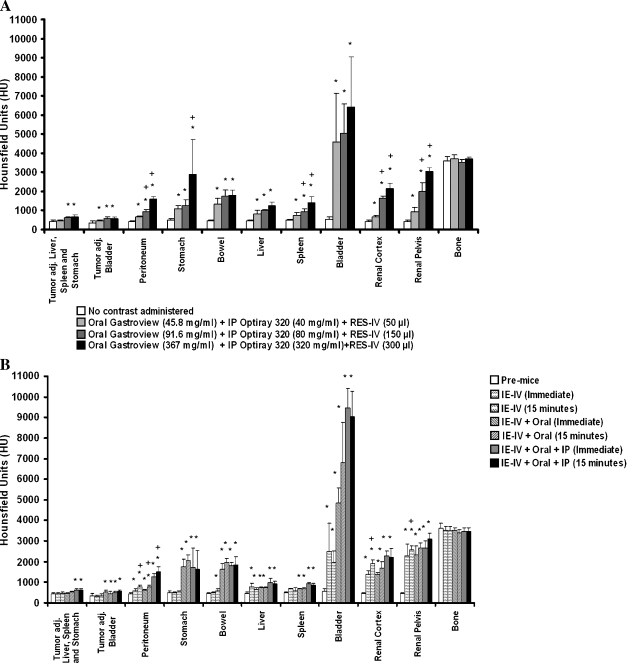
Figure 2.
(A) Quantification of HU in tumors and individual organs after administration of different doses of RES-IV, oral, and IP contrasts. (B) Quantification of HU in tumors and individual organs after administration of IE-IV, oral, and/or IP contrast combinations. In general, the HU of organs increased with increasing amounts of contrasts; in comparison, the HU of tumor increased only minimally. *P < .05 of dose compared with pre-mice with no contrast administered, within the same organ or tumor. (A) +P < .05 of dose compared with previous dose within the same organ or tumor. (B) +P < .05 of dose comparing immediate to delayed imaging within the same organ or tumor.

