
Figure 1. Dose–response curves for radiotherapy.
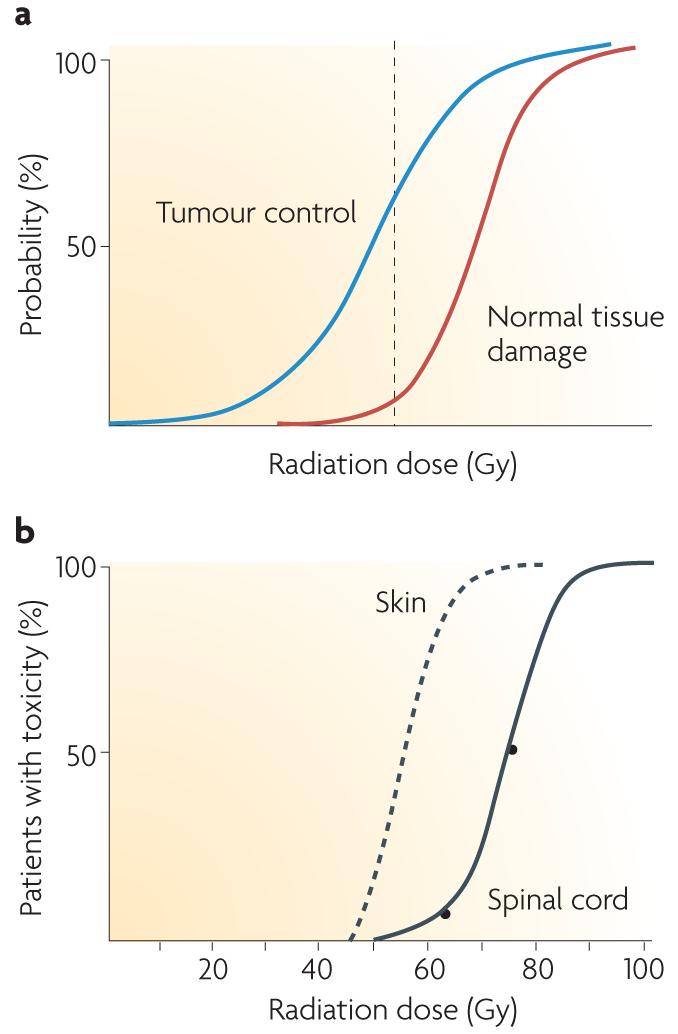
a | The probability of tumour cure increases with increasing radiation dose. As a small volume of normal tissue is unavoidably included in the radiation field, the probability of severe late normal tissue damage also increases. Radiotherapy schedules have developed to maximize cure while minimizing toxicity, and the dotted line shows a theoretical dose associated with ∼60% tumour control and ∼5% severe late toxicity. b | Cumulative frequency dose–response curves. The left-hand curve shows data for skin telangiectasia130; the right-hand curve is the putative dose–response curve for spinal cord necrosis131. The gradients of the two curves are similar, although the dose at which damage occurs is greater for the spinal cord than skin because of differences in target cells, tissue architecture and cell turnover. Interestingly, inbred animals have an even steeper gradient of the dose–response curve. The principal reason why human clinical data show shallower dose–response curves than inbred animals is inter-individual variability, that is, greater genetic variation, although animal studies are more carefully controlled for factors such as diet, age and co-morbidities than human studies.