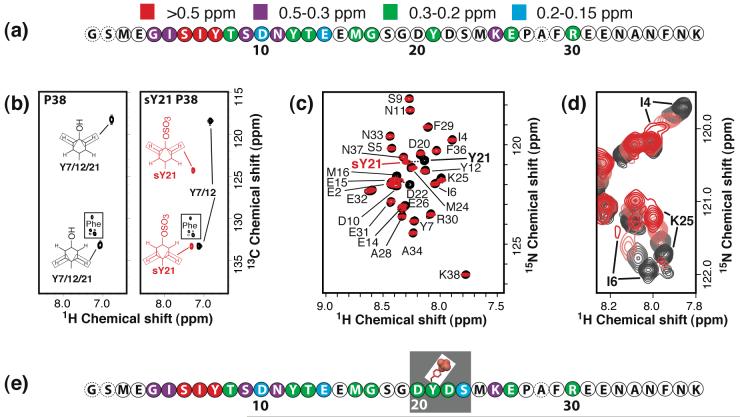
Figure 2.
Characterization of sY21 P38 by NMR. (a) The sequence of P38 with combined 1H/15N chemical shift perturbations from titration with SDF-1α as indicated: red, > 0.5 ppm; purple, 0.5-0.3 ppm; green, 0.3-0.2 ppm; and blue, 0.2-0.15 ppm. HSQC spectra of 15N P38 (250 μM in 20 mM MES at pH 6.8) were monitored during the course of a titration with SDF-1α to a final ratio of 1:1. Extensive line broadening was observed at higher SDF-1α concentrations. (b) Aromatic 13C-1H HSQC spectrum of P38 (left) and sY21 P38 (right). Assignments for 1Hδ-13Cδ and 1Hε-13Cε cross peaks are indicated, and peaks corresponding to sY21 are highlighted in red. No changes in the aromatic 1H and 13C shifts are observed for Y12 and Y7. (c) Assigned portion of a 15N-1H HSQC spectrum of P38 (black contours) overlaid with the spectrum of sY21 P38 (red contours) showing large chemical shift differences for Y21 and D22 upon sulfation of Y21, while Y7 and Y12 are unperturbed. (d) Overlaid portions of 15N-1H HSQC spectra of sY21 P38 with 0 (black), 0.25 (gray), 0.5 (light red) and 1 (red) equivalents of SDF-1α. As with P38 N-terminal residues, like I4 and I6, showed extensive line broadening at and above 1:1 peptide to SDF-1α. (e) The sequence of sY21 P38 with chemical shift perturbations from titration with SDF-1α illustrated as in panel (b). Residues of sY21 P38 that display larger shift perturbations than P38 upon SDF-1α binding are boxed.

