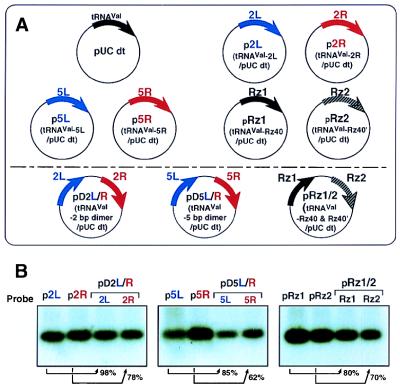
Figure 3.
Schematic representation of the vectors encoding tRNAVal-enzymes (A) and the levels of expressed tRNAVal-enzymes (B). When vectors encoding two tRNAVal-enzyme cassettes (A Lower) had been used to transfect cells, the probes that were complementary to the sequences of respective ribozymes/maxizymes were used independently. The percentage decrease in the level of expression from the vector with two cassettes (A Lower), as compared with that from the corresponding vector with one cassette (A Upper), is shown by an arrow in each cases.

