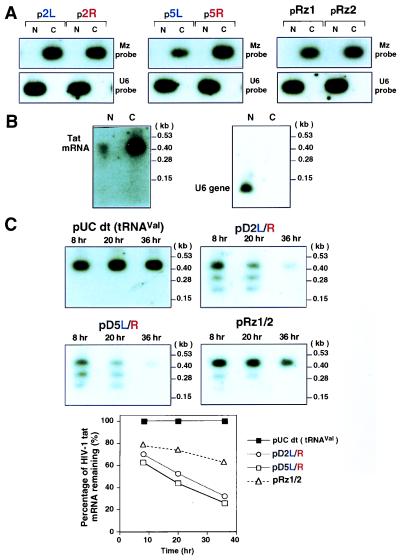
Figure 5.
Intracellular localization of expressed tRNAVal-enzymes (A) and of tat mRNA (B). U6 small nuclear RNA, which remains in the nucleus, was included as a control. Time courses of reductions in levels of HIV-1 tat mRNA by the expressed tRNAVal-enzyme(s) also are shown in C (calculations were based on densitometric measurements from autoradiograms). N, nuclear fraction; C, cytoplasmic fraction.

