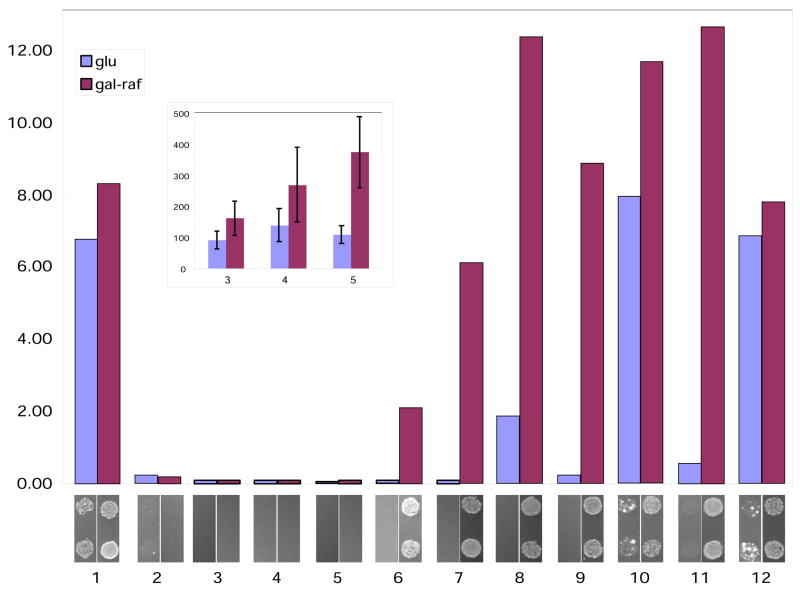
Figure 3. Activation of colorimetric and auxotrophic reporters by zipper interaction in yeast.
Lane numbers below bar graph represent pairs of samples defined in Table 1. Bar graph reflects relative reporter activity measured by beta-glucuronidase assay using PNP-gluc as a substrate. Expression of the AD-fusion protein in yeast is inducible by galactose. Therefore, beta-glucuronidase activity revealed upon the growth on glucose (blue bars with “glu”) represents mainly contribution of bait alone, while activity upon the growth in the presence of galactose (dark-red with “gal-raf”) reflects the interaction between bait and prey. Results shown represent mean values for 3 independent experiments. Standard deviation (not shown) was variable but did not exceed 25% of the experimental value, as is typical for yeast two hybrid experiments. Inset, indicated samples re-analyzed using MU-gluc as a substrate. For context, values obtained for combination 6 (with a Kd of 1 × 10⁻⁸ M), were more than 10-fold higher than those with combination 5 with the MU-gluc substrate, indicating a significant discriminating function of the yeast two-hybrid system in this affinity range (not shown). Shown below bar graph is the growth of two representative spots of colonies 2 days after plating to selective medium.
Data shown are obtained using the SKY191 strain and pGLS20 as bait plasmids. Similar results were obtained using a combination of the PRT50 strain and pGLS22 bait plasmid (data not shown).

