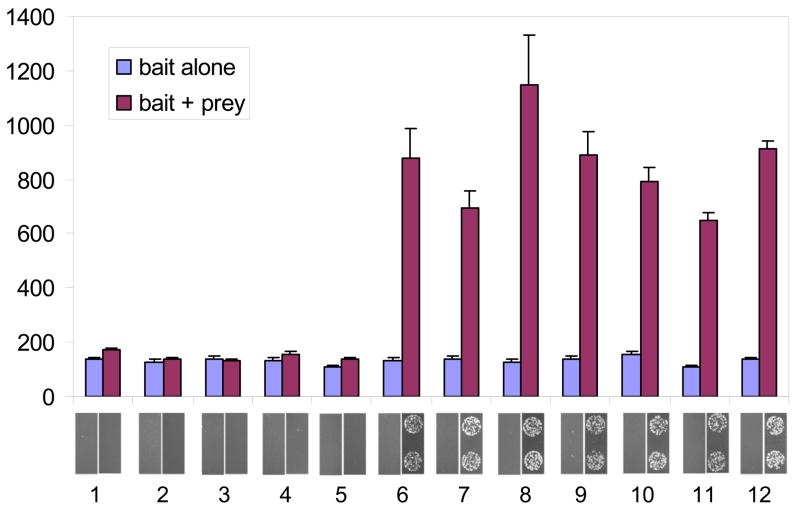
Figure 4. Activation of colorimetric and auxotrophic reporters by zipper interaction in bacteria.
Lane numbers below bar graph represent pairs of samples defined in Table 1. Bar graph reflects relative reporter activity measured by β-galactosidase assay using ONPG as a substrate. β-galactosidase values are expressed in Miller units and represent the mean of three independent measurements with standard errors of the mean shown. The panel below the bar graph presents the growth of two representative spots of colonies 24 hours after plating to selective medium.

