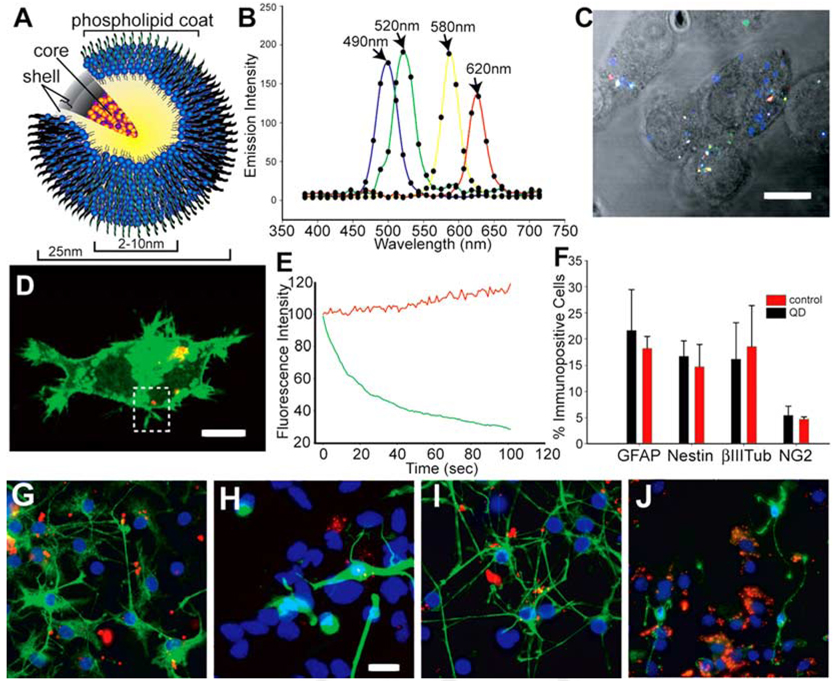
Fig. 1. The composition and spectral characteristics of quantum dots.
A: The quantum dots (QDs) have CdSe core/ZnS shell covered by a phospholipid coat to which ligands and amine and carboxy groups can be added to functionalize the QDs. B,C: N2a cells were loaded with an equimolar mix of 490-nm, 520-nm, 580-nm, and 620-nm QDs in vitro using Lipofectamine (LF) 2000. Twenty-four hours later, the cells were imaged using multiphoton excitation at 800 nm and detected with Zeiss Meta detector. The emission fingerprints of the four QDs are graphed in B, and an unmixed lambda stack image is shown in C. D,E: N2a cells were simultaneously loaded with 620-nm QDs and transfected with farnesylated enhanced green fluorescence protein (EGFP-F) using LF2000. The region of interest (dotted area) in D was scanned 120 times using a 488-nm argon laser to excite EGFP-F and a 633-nm HeNe laser for the QD excitation. Traces of fluorescence intensity vs. time in E demonstrate that the QD emission increased slightly during repetitive illumination while EGFP fluorescence faded. F–J: To track the differentiation of QD-loaded cells in culture, neurospheres cultured from embryonic day (E) 14.5 ventral telencephalon were dissociated and the resulting cells were labeled with 620-nm QD using LF2000 for 1 day in proliferation medium. G–J: After 7 days of subsequent culture in differentiation medium, the cells were immunostained for nestin (G), βIII-tubulin (H), glial fibrillary acidic protein (GFAP, I) and NG2 (J). F: No significant difference in the percentage of immunopositive cells for any antigen was found after neural stem cell differentiation (F). Scale bars = 10µm in C,D, 15µm in G–J.

