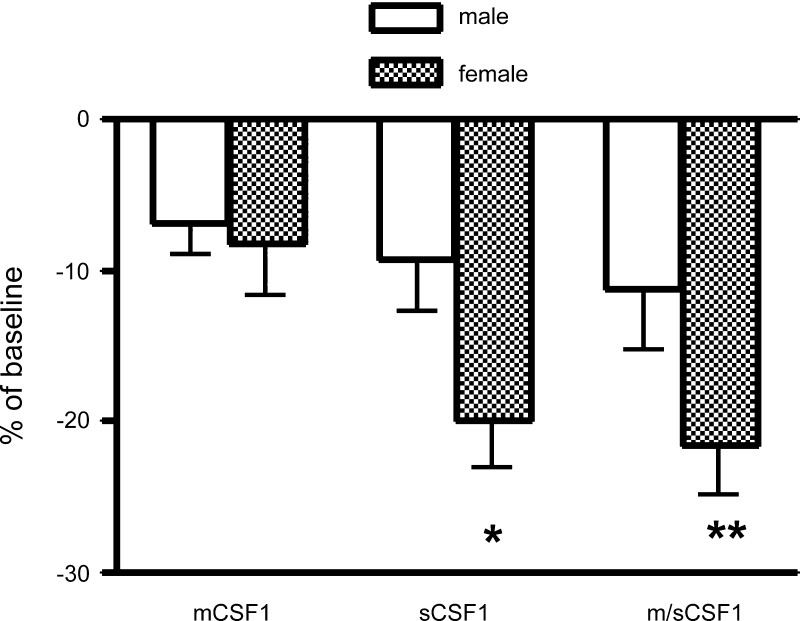
Fig. 2.
Percent reduction in BMD in male and female mCSF1 transgenic, sCSF1 transgenic, and m/sCSF1 double transgenic animals compared with wild-type littermates. Mean tibial BMD values (g/cm2) in these groups were as follows: male mCSF1 = 402 ± 9, female mCSF1 = 437 ± 14, male sCSF1 = 393 ± 16, female sCSF1 = 381 ± 14, male m/sCSF1 = 384 ± 13, female m/sCSF1 = 374 ± 10, male wild type = 432 ± 13, and female wild type = 476 ± 31. **P < 0.01, compared with male m/sCSF1. *P < 0.05, compared with male sCSF1.

