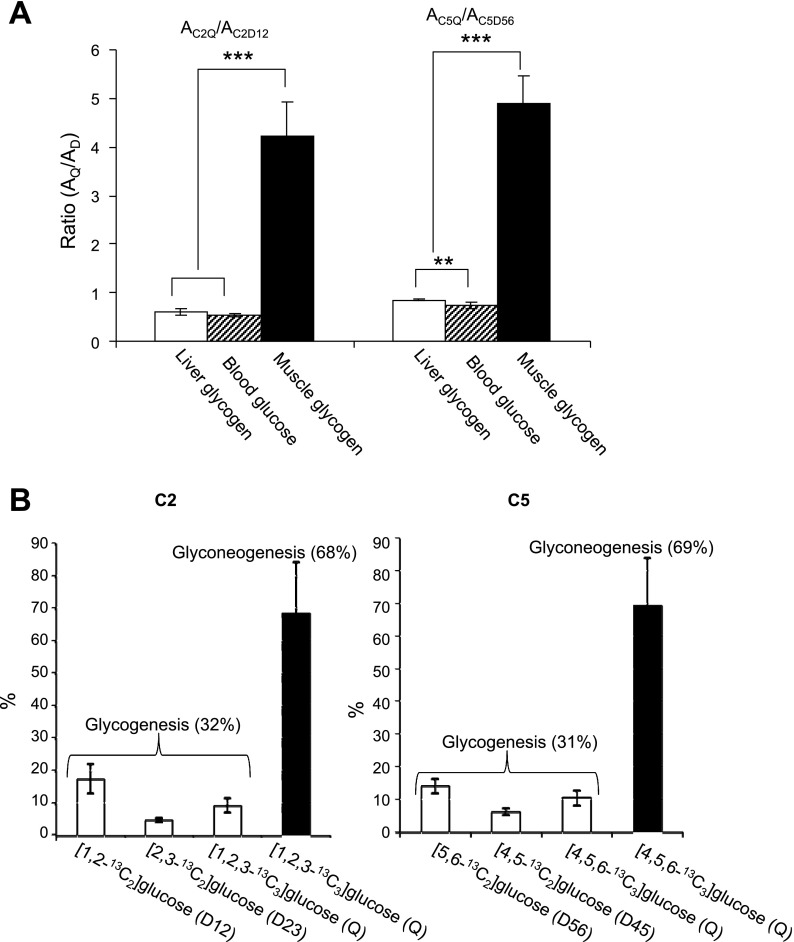
Fig. 7.
A: graph of peak area ratios, AC2Q/AC2D12 and AC5Q/AC5D56, based on 13C NMR analysis of MAG derived from liver glycogen, blood glucose, and skeletal muscle glycogen of whole animals treated with [U-13C3]lactate (spectra shown in Fig. 6). B: graphs showing the relative distributions of multiply labeled glucose units in skeletal muscle glycogen originated from blood glucose (∼30%) and from de novo glycogen synthesis (∼70%) of the whole animals (spectra shown in Fig. 6C). **P < 0.01 and ***P < 0.001.

