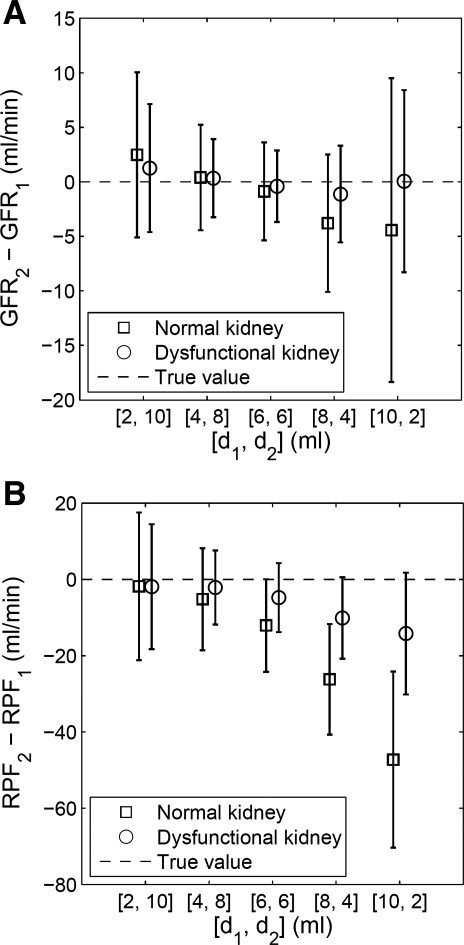
Fig. 2.
Monte Carlo simulated estimates of renal function expressed as differences in renal function between first and second MR renography (MRR) acquisitions using d1 for the first injection and assuming a total dose of 12 ml (d2 = 12 ml − d1). Plots show the simulated changes in renal function: GFR2 − GFR1 (A) and RPF2 − RPF1 (B) for each combination of doses and for 2 scenarios, a normally functioning kidney and a dysfunctional kidney. In this simulation, the true values of GFR2 − GFR1 and RPF2 − RPF1 are 0. Error bars denote mean value ± SD.

