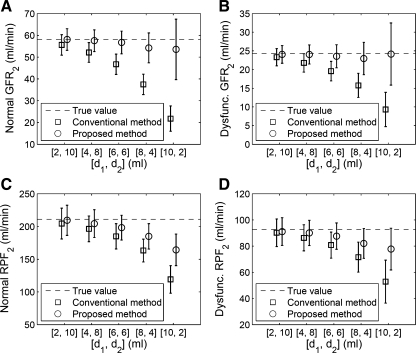
Fig. 3.
Monte Carlo simulated estimates of renal function parameters (mean ± SD) for the second of 2 MRR acquisitions. A and B: GFR2 of the normal and the dysfunctional kidneys. C and D: RPF2 of the normal and the dysfunctional kidney. Two methods of correcting tracer residue from the first injection are tested: conventional background subtraction method (shown as squares) and initial value method described by equation 6 (circles). Results show consistently lower bias using the initial value method. Dashed lines are true values for the parameters in the simulation. At dose distribution (d1, d2) of 4 and 8 ml, the proposed initial value method reduces measurement bias while preserving the precision of GFR and RPF.

