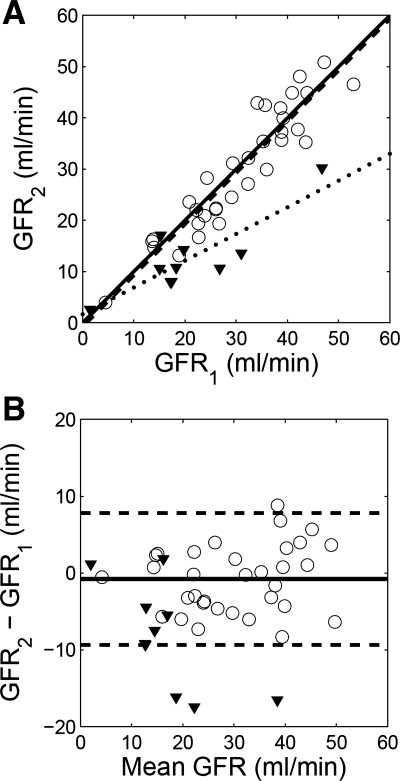
Fig. 6.
Comparison of baseline GFR (GFR1) and second-injection GFR (GFR2) measured using a dual-injection MRR protocol. A: correlation plot and linear regression. For the nonstenotic kidneys (displayed as circles), correlation coefficient is 0.931, and regression line y = 1.00x − 0.77 (dashed line); for the stenotic kidneys (triangles), correlation coefficient is 0.870, and regression line y = 0.52x + 1.67 (dotted line). The solid line is the identity line. B: Bland-Altman plot. Difference between the 2 GFR estimates for the nonstenotic kidneys (displayed as circles) averaged −0.8 ml/min with 95% confidence interval between −9.3 and 7.8 ml/min (dashed lines). Differences between the 2 GFR estimates for the stenotic kidneys are shown as triangles.

