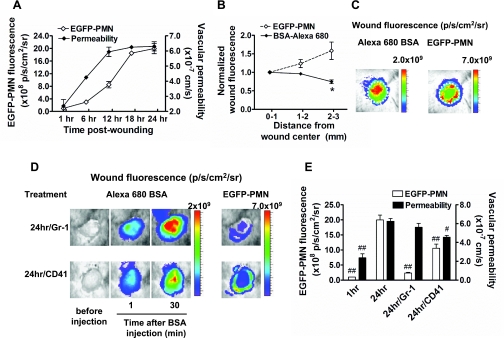
Fig. 3.
Spatiotemporal analysis of vascular permeability and polymorphonuclear neutrophil (PMN) influx in response to immunodepletion. A: kinetics of enhanced green fluorescent protein (EGFP)-PMN infiltration and vascular permeability. B and C: spatial mapping of EGFP-PMN and BSA-Alexa 680 fluorescence. The average fluorescence intensities of EGFP-PMN and BSA-Alexa 680 are quantified as a function of distance from wound center, normalized to the averaged value at region r = 0–1 mm, and colorized on the basis of intensity. Regions of intense BSA leakage (wound center, r = 0–1 mm region) is distinct from greatest density of PMN influx (wound edge, r = 2–3 mm region). *P < 0.05 with respect to EGFP-PMN group. D: representative fluorescent image of EGFP-PMN and BSA-Alexa 680 under depletion of circulating PMNs (Gr-1) and platelets (CD41) within wound at 24 h postwounding. E: effect of PMN and platelet depletions on vascular permeability. #P < 0.05 and ##P < 0.01 with respect to 24 h group; n = 4 to 8 mice in each group.

