Fig. 1.
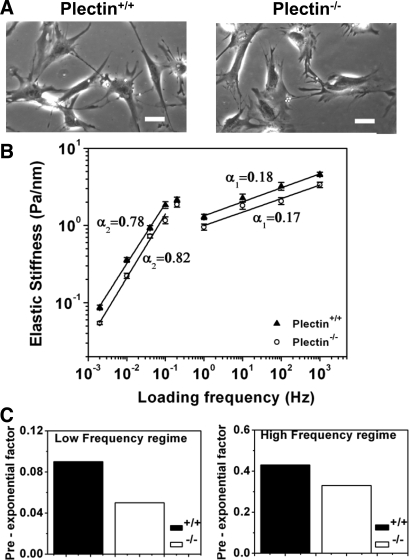
Plectin-deficient (plectin−/−) cells are less stiff than wild-type (plectin+/+) cells. A: phase-contrast images of plectin+/+ and plectin−/− cells showing that they are similar in cell spreading after being plated overnight on collagen-I-coated dishes. Scale bars = 40 μm. B: plectin−/− cells are less stiff than plectin+/+ cells, but power law slopes are similar in response to varying forcing frequencies. The applied stress was 8.75 Pa. Elastic stiffness data are shown. The weak power law exponent α1 (equal to 0.18) of plectin+/+ cells was similar to that of plectin−/− cells (α1 = 0.17), although they were statistically different (P < 1 × 10⁻⁵); the strong power law α2 (equal to 0.78) of plectin+/+ cells was different from that of plectin−/− cells (α2 = 0.82; P < 0.02). n = 415 beads and ∼300 plectin+/+ cells, and n = 327 beads and ∼250 plectin−/− cells. When α1 was compared with α2 within the same cell type, P < 8.1 × 10⁻⁷ for plectin+/+ cells and P < 3.1 × 10⁻⁵ for plectin−/− cells. Values are means ± SE. C: plectin+/+ cells exhibited higher preexponential factors than plectin−/− cells. On a log-log scale, the two power law data were fitted with the following equation: G′ = A × (f/f0)α, where G′ is the geometeric mean ± geometric SE, f is the loading frequency, and f0 is the lowest measurable frequency (0.002 Hz). The preexponential factor A (in Pa/nm) can be converted to units of kPa by multiplying by 6.8 (see materials and methods).

