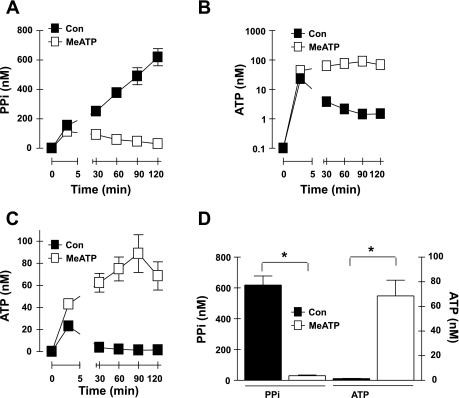
Fig. 2.
Autocrine ATP release and coupled extracellular PPi accumulation in rat aortic VSMC. A–C: extracellular levels of PPi (A, linear scale) and ATP (B, log scale; C, linear scale) following transfer of cultured VSMC to basal saline assay medium in the absence [▪,control (Con)] or presence (□) of 300 μM MeATP. Data points in A–C represent means ± SE from 11–16 separate experiments (each performed in duplicate) with different VSMC preparations at passages 3-4; for some data points, the error bars are smaller than the symbols. D: statistical analysis at the 120-min time points. *P < 0.05, two-way ANOVA with the Bonferroni post hoc test.

