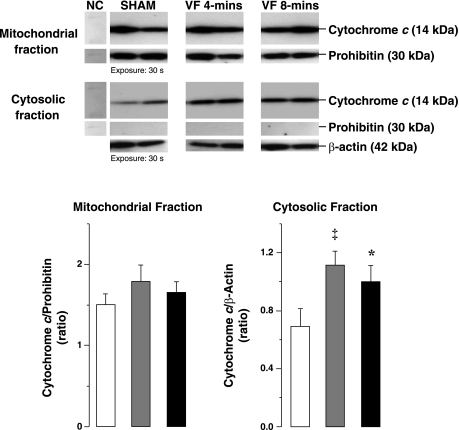
Fig. 1.
Representative immunoblots of left ventricular tissue from 2 sham, 2 ventricular fibrillation (VF) 4-min, and 2 VF 8-min groups showing cytochrome c and prohibitin in cytosolic and mitochondrial fractions and β-actin in cytosolic fraction. The corresponding densitometries for the entire group are shown in graphs depicting cytochrome c in mitochondrial fraction indexed to prohibitin (left) and cytochrome c in cytosolic fraction indexed to β-actin (right). White columns denote sham (n = 8), gray columns denote VF 4-min (n = 8), and black columns denote VF 8-min (n = 8). NC, negative control. Means are ± SE. *P < 0.05, ‡P < 0.01 vs. sham by 1-way ANOVA and Holm-Sidak's test for multiple comparisons.

