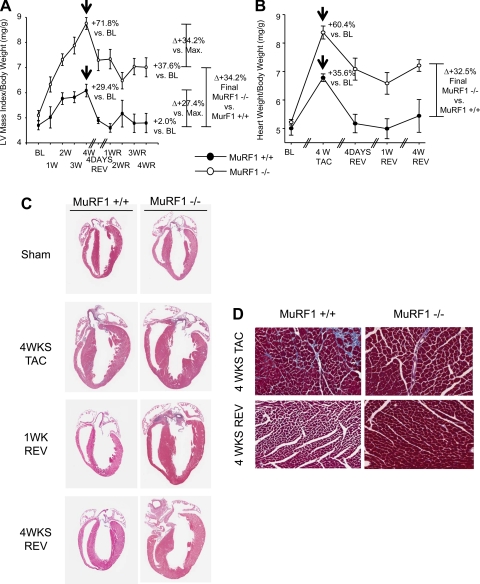
Fig. 2.
Histological and mass analysis of MuRF1−/− and wild-type (WT) mice after 4 wk of transaortic constriction (TAC) and 4 wk after TAC reversal (Rev/R). A: echocardiographic determination of LV mass. BL, baseline; Max, maximum. n = 3–25 mice/group. B: actual determination of heart weight/body weight. n = 3–7 mice/group. Arrows indicate the reversal of TAC. C and D: representative histological cross sections at low power (C; hematoxylin and eosin stained; magnification: ×0.7) and high power (D; Masson's trichrome stained; magnification: ×20). In C, the histological analysis was representative of 2–3 individual mice/group.

