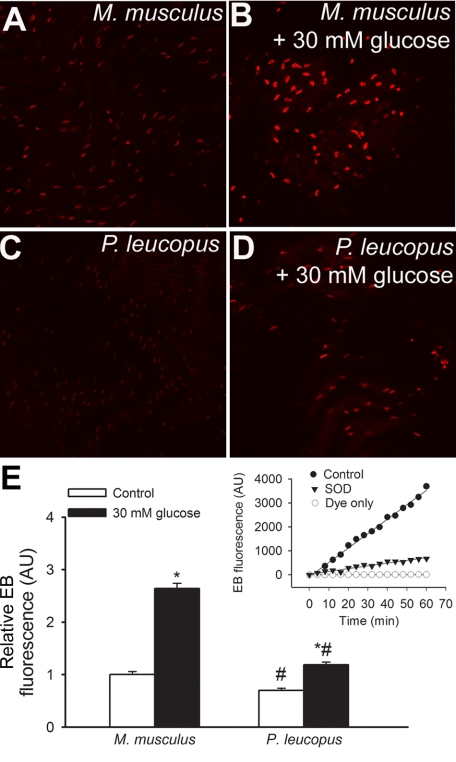
Fig. 2.
Results from dihydroethidine (DHE) staining experiments in en face aortic preparations to measure vascular O2•− production [DHE reacts with O2•− to form the fluorescent product ethidium (EB)]. A–D: representative confocal images showing EB staining (red fluorescence) in endothelial cells of aortas from Mus musculus (A) and Peromyscus leucopus (C; original magnification: ×20). High glucose treatment (30 mM for 24 h) substantially increased EB staining in M. musculus endothelial cells (B), whereas P. leucopus cells were more resistant to high glucose-induced oxidative stress (D). E: time course of the build up of EB fluorescence in aortic segments of mice. Bar graphs are summary data for slope factors normalized to cell number (i.e., nuclear DNA content, as assessed by Hoechst fluorescence intensity), representing tissue O2•− production. Data are means ± SE [in arbitrary units (AU) of ΔEB fluorescence/dt/DNA content]; n = 5 animals/group. *P < 0.05 vs. untreated animals; #P < 0.05 vs. M. musculus. Inset, control experiments showing increases in EB fluorescence in the presence of a vascular sample (control) treated with or without polyethylene glycol (PEG)-SOD or the assay buffer (DHE dye) only.

