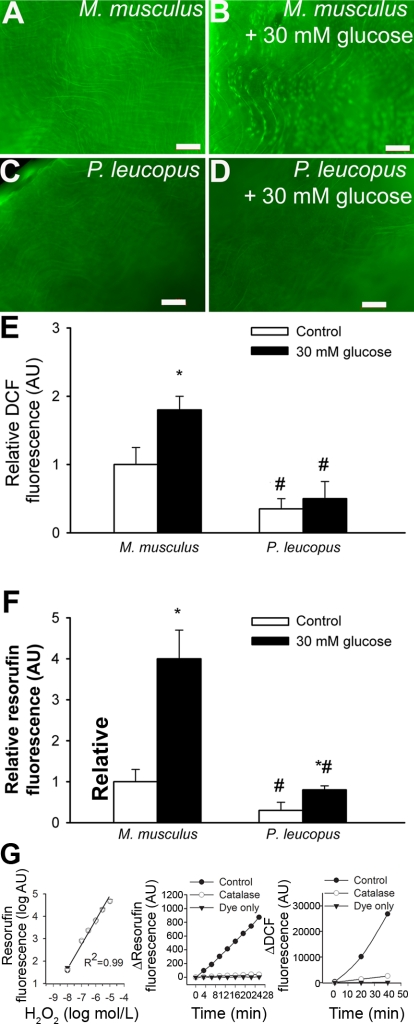
Fig. 4.
A–D: representative fluorescent images showing H2O2 production [measured by the 5 (and 6)-chloromethyl-2′,7′-dichlorodihydrofluorescein diacetate acetyl ester (C-H2DCFDA) fluorescence method] in endothelial cells of en face preparations of aortas of M. musculus (A and B) and P. leucopus (C and D). High glucose treatment (30 mM for 24 h) substantially increased dichlorofluorescein (DCF) staining in M. musculus vessels (B), whereas P. leucopus cells were more resistant to high glucose-induced oxidative stress (D). Green fluorescence shows DCF (original magnification: ×10). E: time course of the build up of DCF fluorescence in aortic segments of mice. Bar graphs are summary data for slope factors normalized to cell number (i.e., nuclear DNA content, as assessed by Hoechst fluorescence intensity), representing tissue H2O2 production. Bar graphs are summary data of DCF fluorescent intensities in endothelial cells of M. musculus and P. leucopus aortas. Data are means ± SE (in AU of ΔDCF fluorescence/dt/DNA content); n = 5 animals/group. *P < 0.05 vs. untreated animals; #P < 0.05 vs. M. musculus. F: results from Amplex red/horseradish peroxidas assays. Shown is the time course of the build up of resorufin (the fluorescence product formed from Amplex red) fluorescence by aortic segments of M. musculus and P. leucopus. M. musculus aortas showed a significantly steeper slope than P. leucopus vessels both under steady-state conditions and after high glucose treatment. Data are means ± SE; n = 5 animals/group. *P < 0.05 vs. untreated animals; #P < 0.05 vs. M. musculus. G, left: increases in resorufin fluorescence in response to exogenous H2O2. Also shown are the time-dependent increases in resorufin (middle) and DCF (right) fluorescence in the presence of a vascular sample (control) treated with or without PEG-catalase or the assay buffer (Amplex red or C-H2DCFDA, respectively) only.

