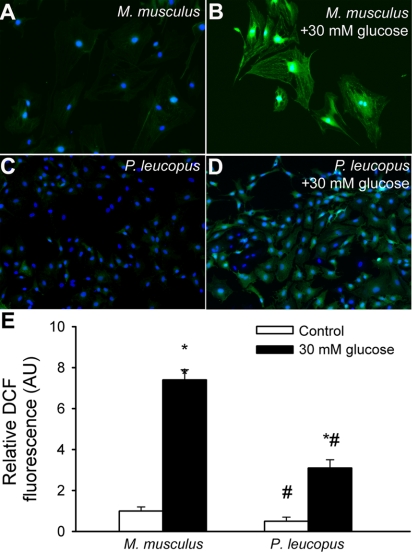
Fig. 5.
Representative fluorescent images showing stronger cellular C-H2DCFDA staining (green fluorescence; an indicator of production of ROS, including H2O2) in primary M. musculus fibroblasts (A) than in P. leucopus fibroblasts (C). High glucose treatment elicited substantial increases in DCF fluorescence in M. musculus fibroblasts (B), whereas high glucose-induced increases in mitochondrial ROS generation were significantly lower in P. leucopus fibroblasts (D). Hoechst 33258 (blue fluorescence) was used for nuclear staining. E: bar graphs are summary data of DCF fluorescent intensities in control and high glucose-treated M. musculus and P. leucopus fibroblasts. Data are means ± SE. *P < 0.05. untreated animals; #P < 0.05 vs. M. musculus.

