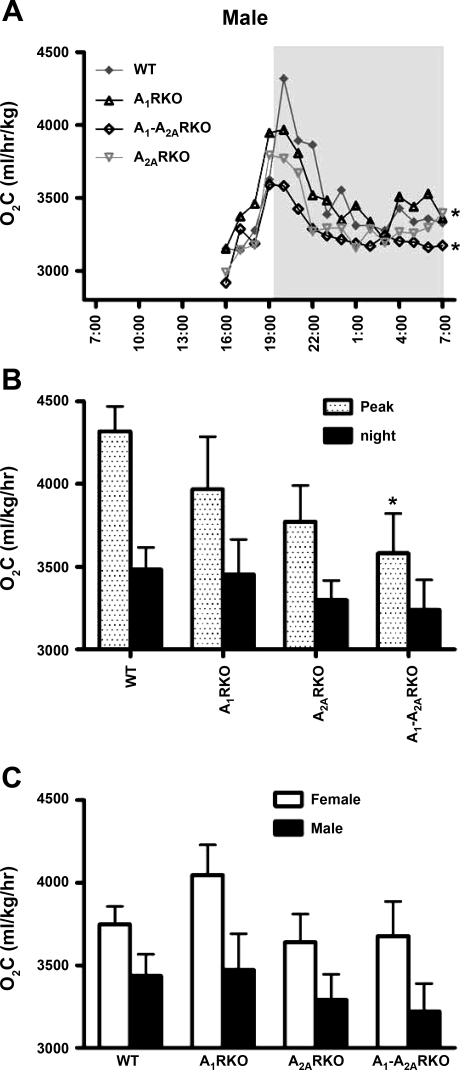
Fig. 5.
Genotype differences in O2C. Abbreviations are the same as in legend to Fig. 1. A: O2C was measured for 60-min periods in WT (F, n = 7; M, n = 6), A1RKO (F, n = 7; M, n = 9), A1-A2ARKO (F, n = 6; M, n = 7), and A2ARKO mice (F, n = 7; M, n = 4) mice. The dark period is from 7 PM to 7 AM. B summarizes the top panel. The black column shows the O2C average between 9 PM and 5 AM; the spotted column for Peak shows the O2C average between 7:30 PM and 8:30 PM. Data are presented as mean values or mean values ± SE (*P < 0.05 compared with WT mice). C: O2C (Oxygen) was measured for 16-h mice.

