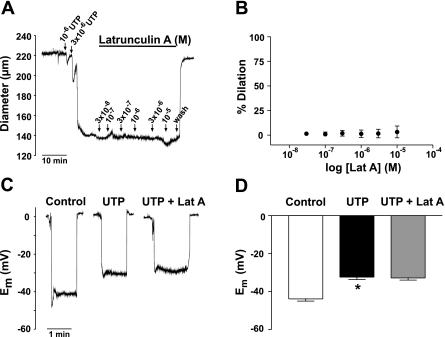
Fig. 7.
Effect of latrunculin A on UTP-induced depolarization and constriction. A: representative trace showing the effects of increasing concentration of latrunculin A on an artery preconstricted with UTP. B: summary data of the concentration-dependent effect of latrunculin A on a preconstricted artery (n = 6). C: representative recordings of smooth muscle Em measured under control conditions and in the presence of UTP ± latrunculin A (1 × 10⁻⁵ M). D: summary data of Em measured under control conditions and in the presence of UTP ± latrunculin A (n = 6). *Statistical difference from control.

