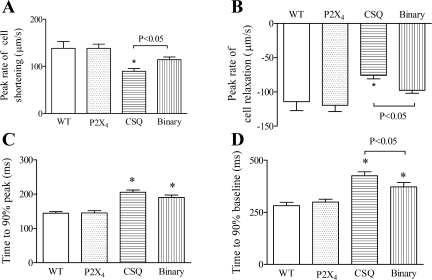
Fig. 2.
Characterization of the kinetics of cell shortening in binary versus CSQ cardiac myocytes. In binary cardiac myocytes (38 myocytes from 25 mice), peak rates of cell shortening (A) and cell relaxation (B) were greater than those in CSQ myocytes (54 myocytes of 28 hearts; P < 0.05). Time-to-90% peak (C) was similar between binary and CSQ myocytes, whereas the time-to-90% baseline (D) in binary Tg myocytes was shorter than that in CSQ myocytes (P < 0.05 by 1-way ANOVA followed by posttest comparison). The kinetics of cell shortening, as measured by rates of shortening and relaxation and by times to 90% peak and to 90% baseline, were similar in WT (34 myocytes from 16 mice) and in P2X4R Tg (45 myocytes from 20 mice) myocytes. *P < 0.05 when compared with either WT or P2X4R Tg by 1-way ANOVA followed by posttest comparison.

