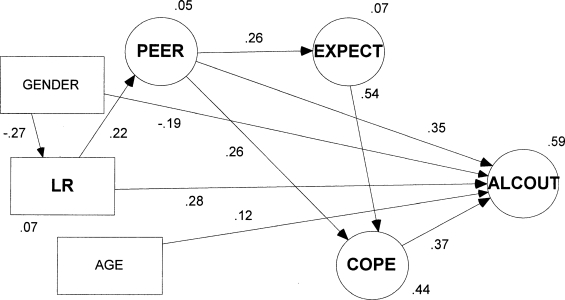
Figure 3.
The structural equation model for the 325 drinking offspring using the measurement model indicators from Figure 2 and the abbreviations presented in Table 1. Here, only significant paths (p < .05) are presented, beta weights are offered for each path, and the final R 2 is noted above ALCOUT.

