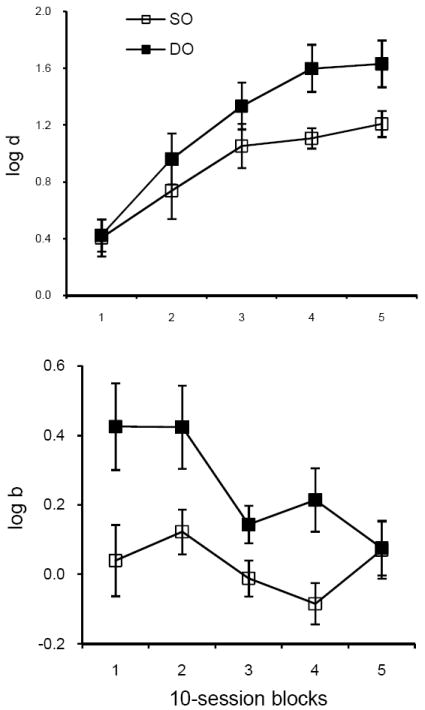
Fig. 1.

The upper panel shows how log d, averaged over retention intervals and subjects, changes in SO and DO components during 50 sessions of baseline training in Experiment 1. The lower panel presents a similar plot for log b. Range bars indicate standard errors.
